Relative Strength Index (RSI) – a Vital Indicator for Huge Profits We notice in the market that the best trends sometimes hit us without us knowing. The RSI is an indicator that shows the momentum of a defined financial instrument and at the same time it explains when it reaches extreme levels to the overbought region (upside) or oversold regions (downside). At these extreme points investors are gearing up for reversal in trend. The Relative Strength Index oscillates between 0 and 100, and is able to achieve this via a formula which compares the size of recent profits for a financial instrument to the size of its recent losses that is subsequently plotted in a line graph.
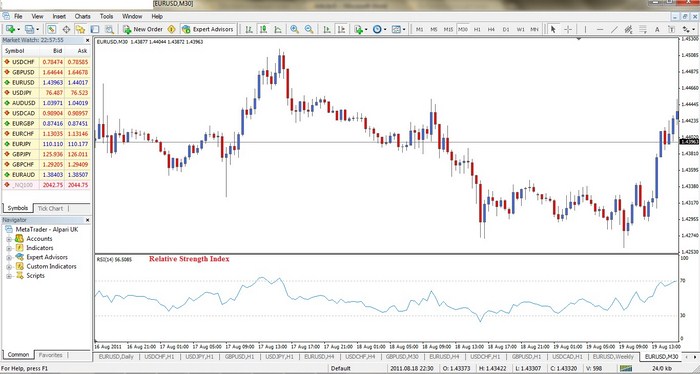
 We have bands that are plotted at the 70 mark (upside) and the 30 mark (downside. The RSI offers investors one of the best risk reward and traders are able to spot them using additional technical tools. The RSI was designed by Wells Wilder and he explained the concept firsthand in his book “New Concepts in Technical trading’. It is a momentum indicator and at most cases the most widely used counter-trend-oscillator around the globe. The RSI in itself does not indicate the markets strength but it does this in comparison to the markets former price activity. Example of the RSI Indicator

Fig. 6.0
 One of the most suitable ways that traders apply the RSI into their trading life is via the identification and obvious trading of the extreme zones (overbought and oversold conditions). Due to the design of the RSI, a reading of 100 would mean zero losses in the dataset that’s been compiled. Meanwhile a reading of 0 describes zero gains, but at the same a very rare occurrence. This is why we have James Wilder who designed the Relative Strength Index select the regions of 70 to describe an overbought condition and 30 to describe an oversold market position. The market becomes overextended to the upside when the RSI line trades beyond the 70 line, at the same time investors look at the market as getting overextended towards the downward region when it trades below the 30 line. With all this in place we find traders looking for opportunities to go bullish when the RSI is below the 30 mark and go bearish when it’s above the 70 mark. As with any other indicator in the currency market place, it is most suitable when other facets of an investor analysis are incorporated with the indicator Conclusion Normally we have discovered that before the trend in price reverses, it would lose momentum. Hence, while we continue to price make new lows and highs, the Relative Strength Index would not be involved in this. The RSI is in a “Divergence” when it isn’t at a new high or low, this warns traders of a possible turn ahead. A 14 period is the basic setting for the RSI. Therefore, iif you are in search of a minute-by-minute price chart or a yearly price chart, the current reading is subject to the very recent fourteen minutes or years of activity. You can also get a suitable setting for yourself, this you might get by trial or error.

Pingback: Parabolic SAR | Capture Market Trends | Forex Investment